Framework · Economics
Break-even analysis
Estimate the activity level where contribution covers the costs included in the model
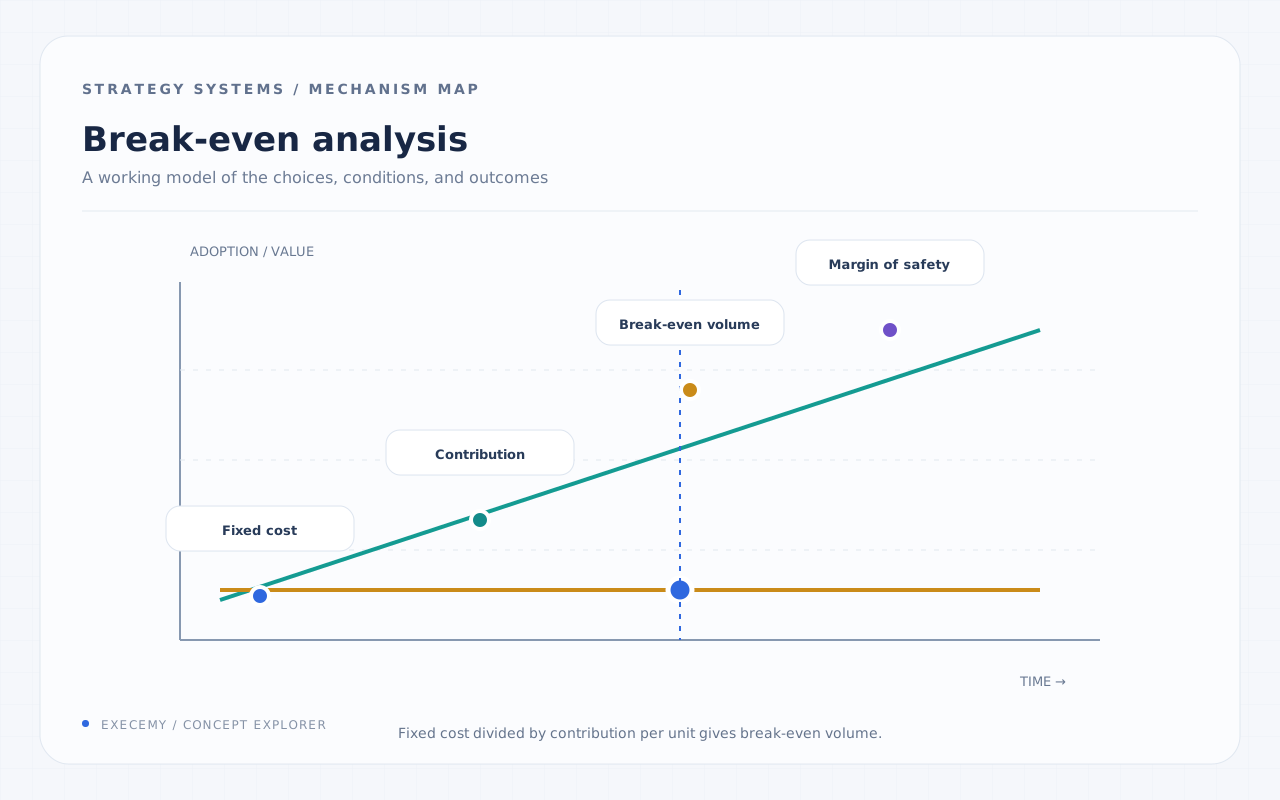
Find the volume that covers the cost base.
Break-even analysis asks how much a business must sell before contribution covers the fixed costs included in the model. For a product with price p, variable cost v and fixed cost F in the chosen period, contribution per unit is p − v and the threshold is Q* = F/(p − v), provided contribution is positive. The formula is conditional: it does not show whether customers want Q* units or whether the business has capacity to serve them.
Break-even analysis calculates the activity at which modeled revenue equals modeled cost, using clearly defined fixed costs, variable costs, prices, and units.
The arithmetic is simple; the assumptions are not. Fixed and variable costs must refer to the same period. A cost may be mixed, such as a base cloud bill plus usage, and may change in steps when capacity is added. The analysis should include discounts, returns, commissions, transaction fees, product mix, staffing thresholds, and any relevant startup or financing costs. For a multi-product business, contribution mix matters; one weighted average can become wrong when the mix changes.
Accounting break-even may use operating costs, while cash break-even asks whether cash inflows cover cash outflows. A project can report accounting profit and still require more cash because customers pay later or inventory grows. State which question the model answers and whether the output is units, customers, transactions, or revenue.
Break-even calculations
Use a formula whose unit matches the decision you need to make.
 Unit volume
Fixed costs per period ÷ (price per unit − variable cost per unit) = units per period.
01
Fixed costs per period ÷ (price per unit − variable cost per unit) = units per period.
Fixed costs per period ÷ (price per unit − variable cost per unit) = units per period. Revenue
Fixed costs ÷ contribution-margin ratio = break-even revenue for the same period.
02
Fixed costs ÷ contribution-margin ratio = break-even revenue for the same period.
 Multi-product mix
Use a weighted contribution based on an explicit, stable product or customer mix.
03
Use a weighted contribution based on an explicit, stable product or customer mix.
A continuum, not a switch
Break-even becomes useful when costs, units, mix, and period are explicit. It remains a scenario calculation and should not be mistaken for a demand forecast.
“Break-even is a conditional estimate, not a forecast that the business will reach it.”
Why it matters
The result makes a proposal discussable. A launch plan can compare required units with reachable demand, capacity, and seasonality. A price change can show how much volume must be recovered to cover a lower per-unit contribution. Sensitivity analysis should vary price, volume, variable cost, and fixed commitment rather than presenting one point as certain.
McDonald’s 2024 filing separates franchised restaurant margins from company-operated restaurant margins and defines different costs for each. That distinction matters for break-even: a franchisee’s labor, food, rent, and capital base are not the same as McDonald’s corporate franchising revenue and occupancy costs. The public filing does not disclose one generic break-even sales number for every restaurant.
For a scarce-capacity decision, compare contribution per limiting resource as well as the break-even threshold. A product can cover its allocated cost model while crowding out a more valuable use of the same kitchen, machine or support team. For a cash decision, add collection timing, startup investment and financing obligations explicitly rather than rename accounting break-even “cash break-even.”
Real-world examples
The same concept shows up in different ways across industries.

When it breaks
A single-product, straight-line model fails when prices, costs or capacity change with volume. A restaurant may need another shift before serving the modeled demand; a SaaS business may have marginal hosting costs and a large committed product team. Use the cost schedule that applies at the candidate threshold. If that threshold requires another capacity step, recompute it using the expanded cost base and check that it lies in the assumed range.
A break-even point ignores uncertainty, time value, and the possibility that demand never arrives. It also says nothing about return above the threshold or whether scarce capital has a better use. Pair it with cash runway, downside scenarios, and a comparison with the next-best alternative. If the input range is wide, show a range instead of false precision.
Key takeaways
- 01
What time period and unit does the calculation cover, and which costs are included or excluded?
- 02
What is contribution per unit after discounts, fees, variable service cost, and mix?
- 03
Can reachable demand cover the threshold at the stated price, cost and mix? Lower achieved volume alone changes profit and the gap to break-even; recalculate the threshold when price, costs, capacity steps or mix change.
Related concepts
See all → Contribution marginCalculate what the next sale leaves after variable costs.
 Unit economicsMake the unit and boundary explicit.
 Capital intensityCapital required for each unit of activity.
 Scenario planningPrepare for several plausible worlds, not one forecast.
 Pricing powerMeasure the contribution after customers respond.
Sources
- Cost-volume-profit analysis · ACCA. Break-even point and contribution-to-sales ratio equations; Limitations of cost-volume profit analysis, constant mix, linear functions, relevant range and fixed/variable classification.
- McDonald’s Corporation 2024 Form 10-K · McDonald’s Corporation / SEC. Printed pp. 7–8 (systemwide sales definition and 2024 results); p. 16 Restaurant Margins, definitions and table; pp. 39–40 Consolidated Statement of Income, 2024 column. HTML headings and row labels are exact locators.