Metric · Economics
Operating leverage
Compare the profit sensitivity hidden behind the same current earnings.

Fixed costs amplify gains and losses.
Two service operators earn the same profit at today’s sales. One has committed facilities and staff but low incremental cost; the other buys more service from suppliers as demand arrives. A sales forecast alone does not reveal their difference. Their operating profits can respond very differently to the same fall in demand. Operating leverage describes that sensitivity within a stated cost model and activity level.
Operating leverage is the sensitivity of operating profit to sales arising from contribution and committed operating costs within a defined range and period.
Write the mechanism before computing a ratio. Operating profit equals contribution minus fixed operating cost. If price and variable cost per unit remain stable, each extra sale adds contribution while committed costs remain unchanged within the relevant range. Near break-even, that addition can be large relative to existing profit. The same mechanism works in reverse: a modest loss of contribution can remove much of the profit. Fixed and variable are short-run classifications, with the horizon determining which inputs can adjust. [MIT lecture summaries, §3.2.1](https://ocw.mit.edu/courses/14-01-principles-of-microeconomics-fall-2023/mit14_01_f23_full.pdf).
In the linear model, degree of operating leverage, or DOL, equals total contribution divided by operating profit at the stated sales level. It follows from differentiating profit with respect to sales and expressing both changes proportionally. It is a local sensitivity of the model. It is not a published company trait that can be carried unchanged through a recession, a fare change or a capacity expansion. Explicitly, with sales S and constant variable-cost share r, profit Π=(1−r)S−F. Its proportional sales sensitivity is (dΠ/dS)×S/Π=(1−r)S/Π=contribution/Π. This is an original derivation from the stated assumptions, not a formula quoted from the MIT cost notes.
Three views of downside exposure
Separate modeled sensitivity, changed conditions and cash obligations.
 Local DOL
Divide contribution by operating profit at one activity level under stable price, mix and cost behavior.
01
Divide contribution by operating profit at one activity level under stable price, mix and cost behavior.
Divide contribution by operating profit at one activity level under stable price, mix and cost behavior. Downside profit scenarios
Recalculate absolute profit at lower sales, changed prices and capacity steps rather than extrapolate one ratio.
02
Recalculate absolute profit at lower sales, changed prices and capacity steps rather than extrapolate one ratio.
 Adjustment and liquidity horizon
Map notice periods, unavoidable cash obligations and restart requirements separately from accounting expense.
03
Map notice periods, unavoidable cash obligations and restart requirements separately from accounting expense.
A continuum, not a switch
This conceptual comparison concerns decision completeness, not a rating of the business.
“Equal current profits can require very different downside plans.”
Why it matters
Two operating structures can earn the same current profit while having different contribution and committed-cost bases. In the linear model Π=(1−r)S−F, S is sales, r the variable-cost share and F the fixed operating cost over the stated range. A structure with greater contribution relative to positive current profit has greater modeled proportional sensitivity. To estimate a company’s sensitivity, the model needs evidence about its contribution and committed costs.
For a proposed lower or higher sales level S′, recompute Π′=(1−r)S′−F only if the cost share and fixed commitment remain applicable. A supplier-price change, capacity step or different product mix requires a different model. The result depends on what adjusts, how soon it adjusts and what capability is lost. An accounting expense category cannot establish those conditions by itself.
A lower DOL is not automatically preferable. A committed asset may provide control, reliability or a capability customers value. An external supplier can change prices or lack capacity when the buyer needs to expand. Compare demand visibility and downside survival with those consequences, using actual contract and operating evidence before assigning values.
Ryanair’s annual euro totals form the reported-data exhibit. They show actual recorded revenue, expense and operating results across the pandemic shock and recovery. They do not split expense into variable and fixed cost or reveal a stable contribution model. Their usefulness is to expose adjustment and identification questions, not to manufacture a company-specific DOL.
Real-world examples
The same concept shows up in different ways across industries.
When it breaks
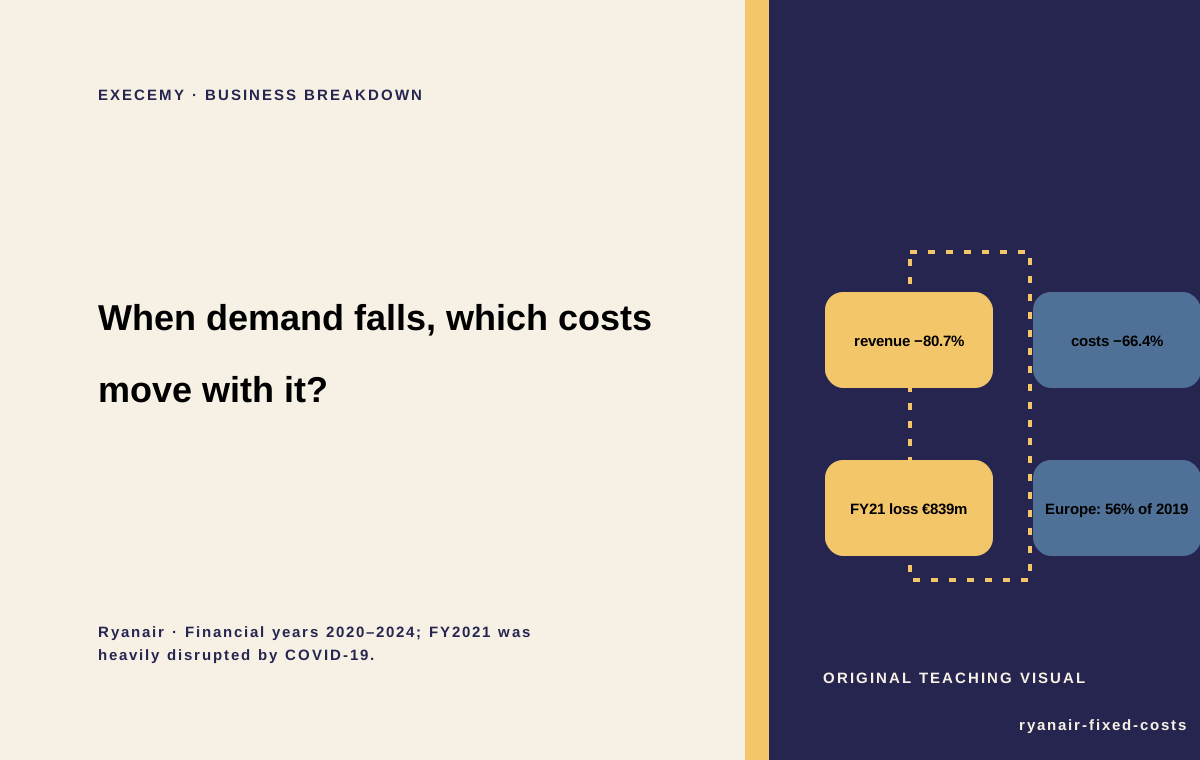
The paired [Ryanair case](/en/breakdowns/ryanair-fixed-costs) uses actual financial totals to expose a different measurement problem. Revenue fell from €8,494.8 million in FY2020 to €1,635.8 million in FY2021, while expenses fell from €7,367.4 million to €2,475.2 million. The differing rates show that expenses did not track revenue proportionally. They do not reveal which expenses were variable or establish Ryanair’s DOL. [Annual Report 2024, Selected Financial Data](https://investor.ryanair.com/wp-content/uploads/2024/06/Ryanair-2024-Annual-Report.pdf).
Do not divide the percentage change in profit by the percentage change in revenue across such a shock and label the result a stable forecast. Price, service levels, restrictions and cost actions all changed. In addition, a loss or near-zero profit makes percentage sensitivity unstable or hard to interpret. Show absolute contribution and cash consequences in downside scenarios instead.
Operating leverage and financial leverage should also remain separate. Interest and debt repayment affect financing and liquidity; DOL concerns operating profit before those obligations. Depreciation can persist in operating expense even when it does not require a current cash payment. An asset can be cash-paid already while maintenance, leases or staff commitments still require cash. A downturn plan needs a cash schedule alongside the operating model.
Finally, a cost called fixed can change after notice, renegotiation or exit. Cutting it may damage restart capability, create termination expense or leave another commitment stranded. Model both the time until cash savings arrive and the cost of restoring service. The apparent flexibility of an accounting category is not evidence of practical flexibility.
Key takeaways
- 01
Same current profit can conceal different downside sensitivity.
- 02
DOL belongs to a stated activity level and cost model.
- 03
Verify how quickly commitments adjust and when cash savings arrive.
Related concepts
See all → Contribution margin
Related cases
See all →Sources
- 14.01 Principles of Microeconomics, Fall 2023 — Full Lecture Summaries · MIT OpenCourseWare. PDF index 6, §2.1.2 Elasticity and §2.1.3 Shifts in demand; PDF index 11, §3.2.1 Short run costs, fixed/variable costs and C=F+VC.
- Ryanair Holdings plc Annual Report 2024 · Ryanair Holdings plc. PDF index 67 (printed p. 65), Selected Financial Data: Total operating revenues, Total operating expenses, Operating profit/(loss), euro columns FY2020–FY2024. PDF indexes 118–119 (printed pp. 116–117), FY2024 versus FY2023 cost review. PDF index 188 (printed p. 186), government payroll supports.
- Ryanair Holdings plc Annual Report FY2021 · Ryanair Holdings plc. Printed pp. 3–5, Chairman’s and CEO’s reports: pandemic restrictions, cost reduction, cash preservation, payroll support and readiness to resume service.